Kansanshi
A copper and gold operation in Zambia. Kansanshi has been our flagship operation since 2005.
Key Metrics
Operational
One of Africa’s largest mines
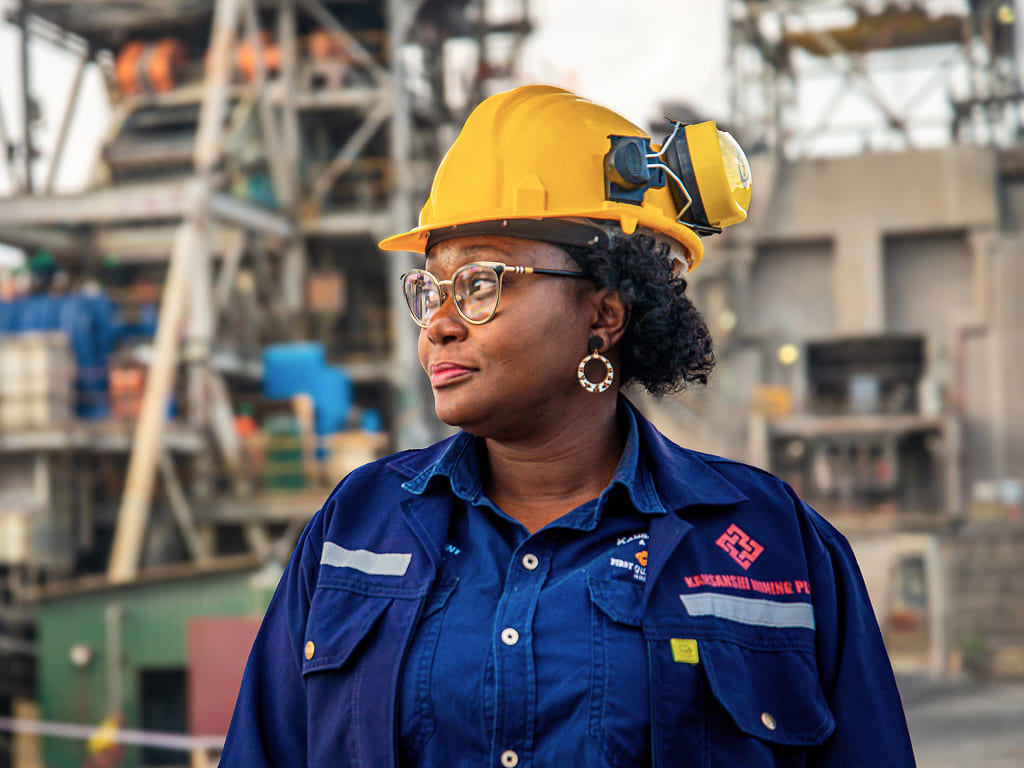
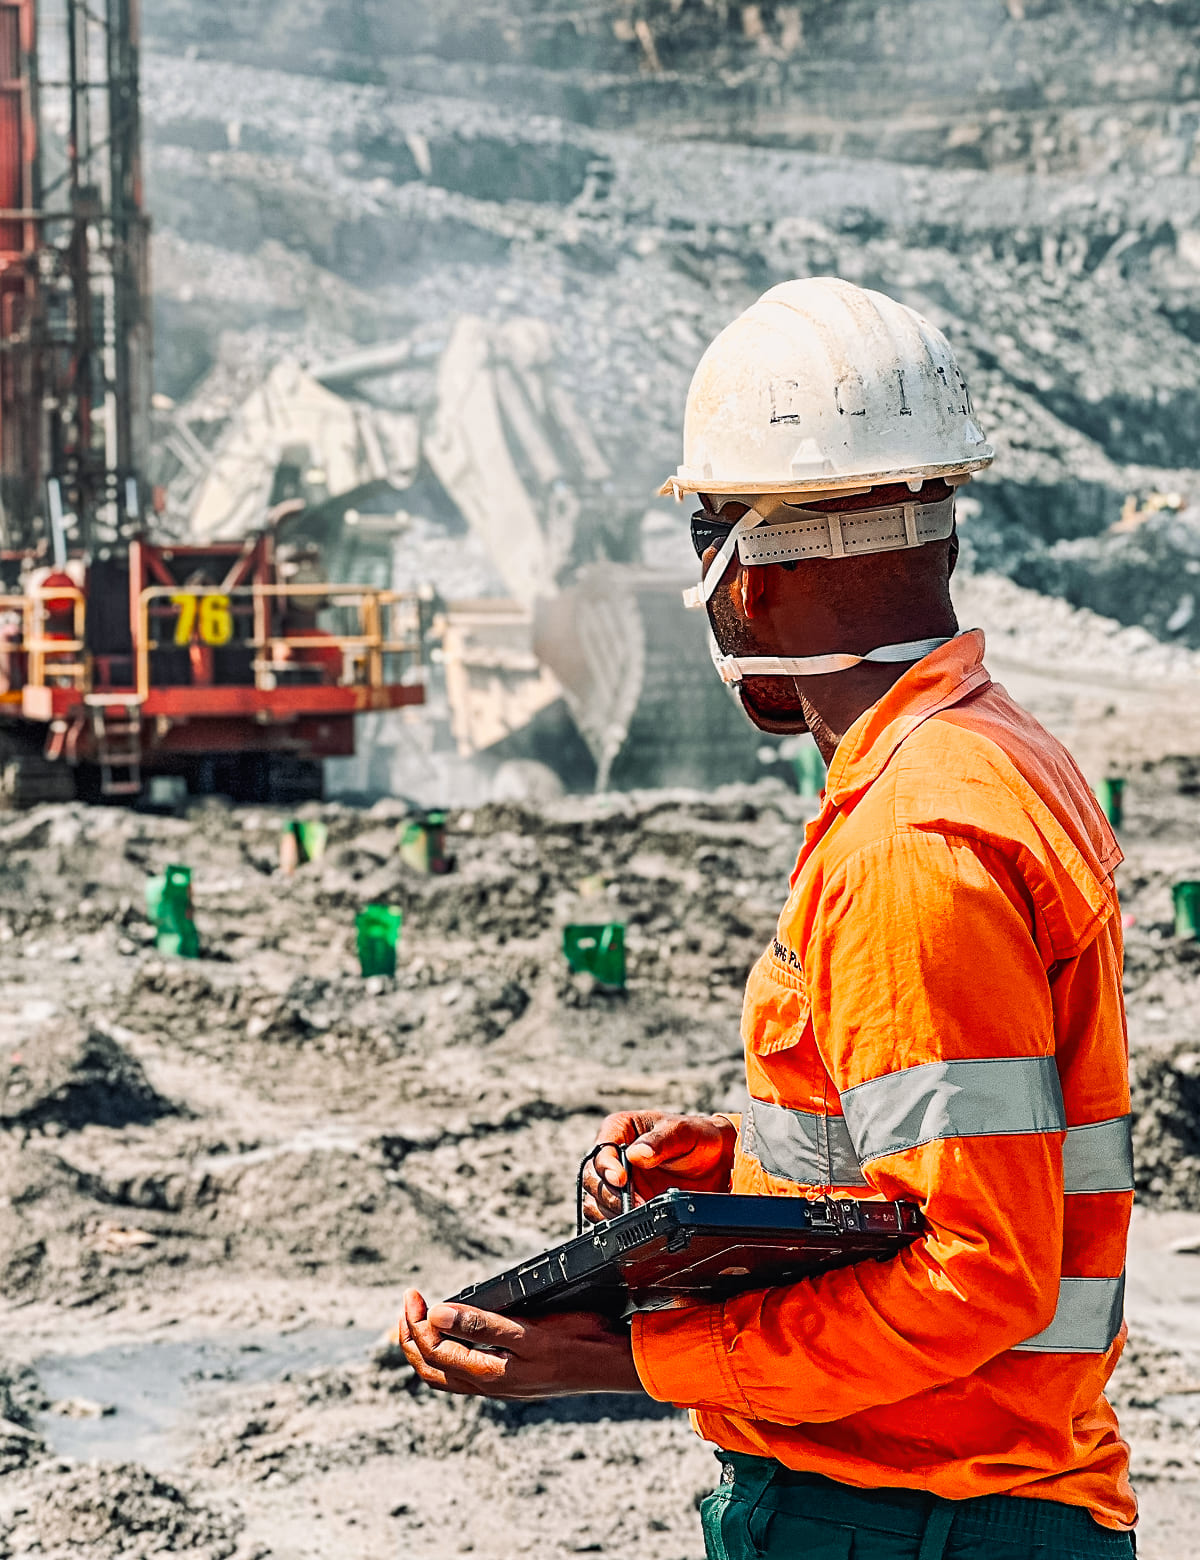
From its three open pits, the Kansanshi copper-gold mine near Solwezi, in the North-Western Province of Zambia, is the largest integrated metallurgical processing facility in Africa.
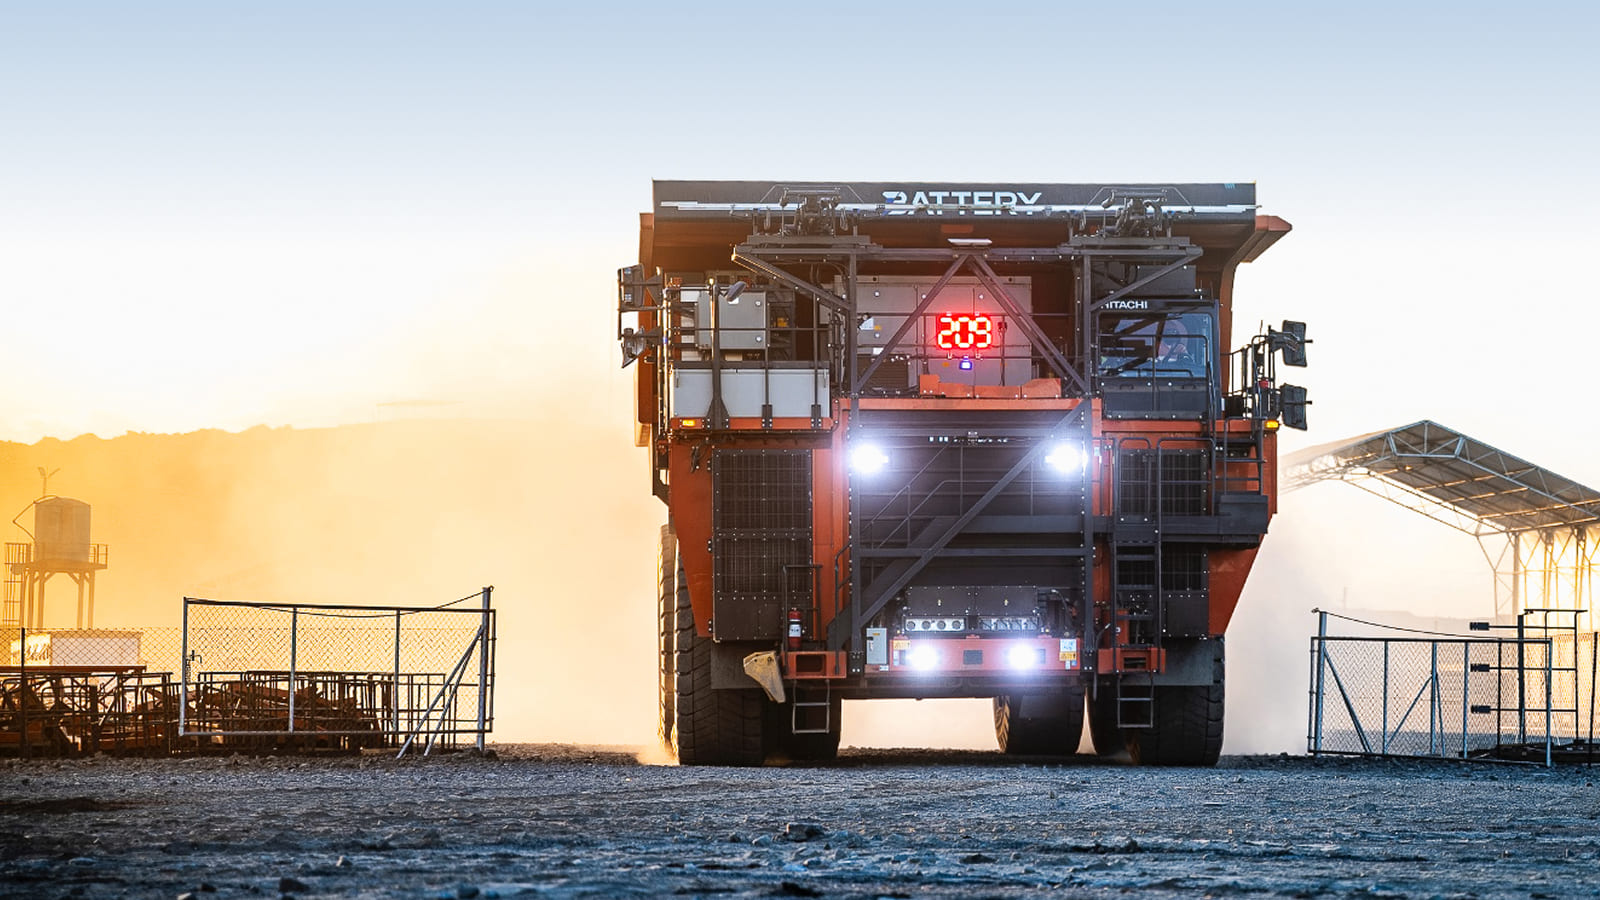
Kansanshi employs more than 13,000 people, primarily Zambians, and uses state-of-the-art technology to extract copper and gold from three different ore types, with world-class efficiency.
The Kansanshi copper smelter, commissioned in the first half of 2015, has enabled First Quantum to optimize the value of the copper it produces in Zambia, and created a further 784 specialist jobs.
The Kansanshi mine is owned and operated by Kansanshi Mining PLC, which is 80 per cent owned by First Quantum.
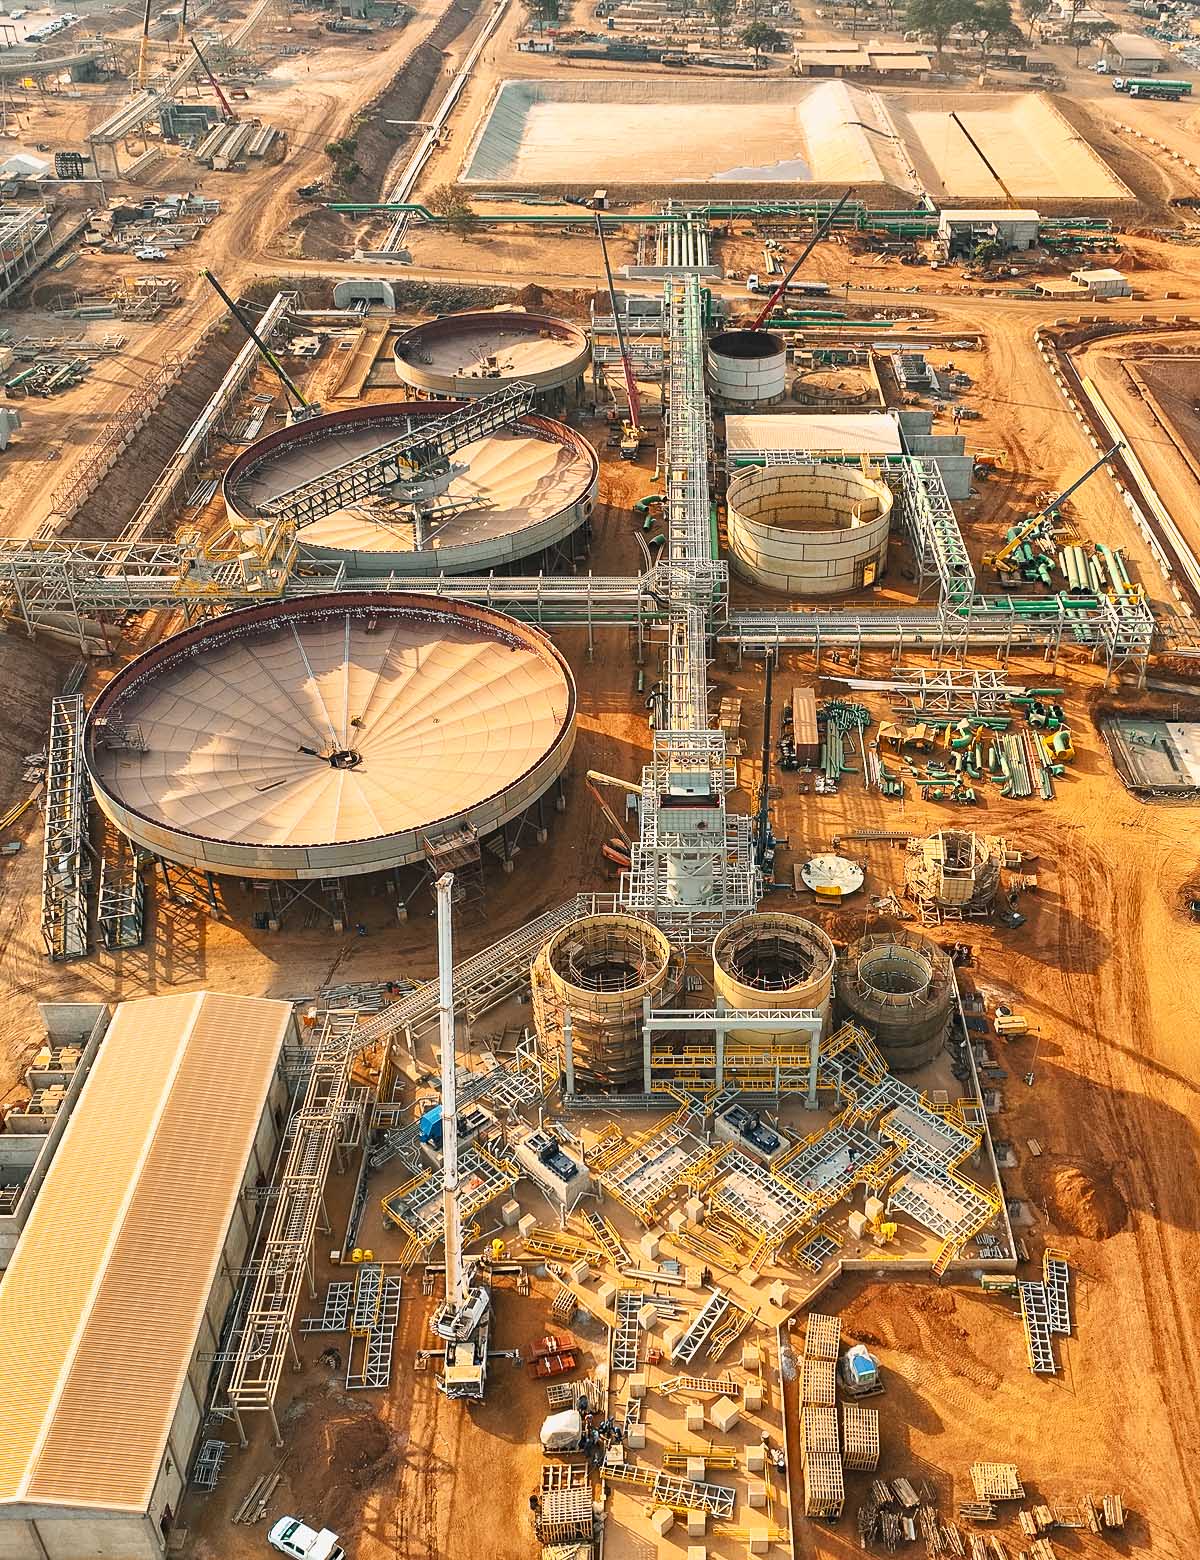
Kansanshi S3 Update
In July 2025 The Kansanshi S3 Expansion project reached the final stages of commissioning with first ore fed through the expansion operations ahead of schedule.

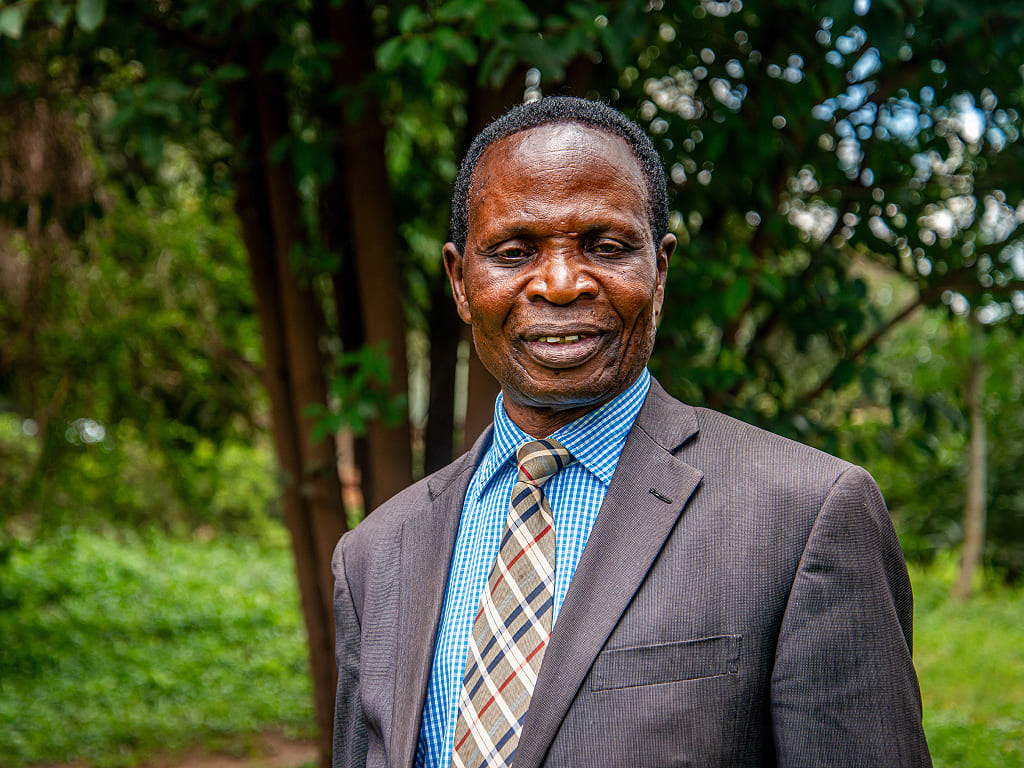
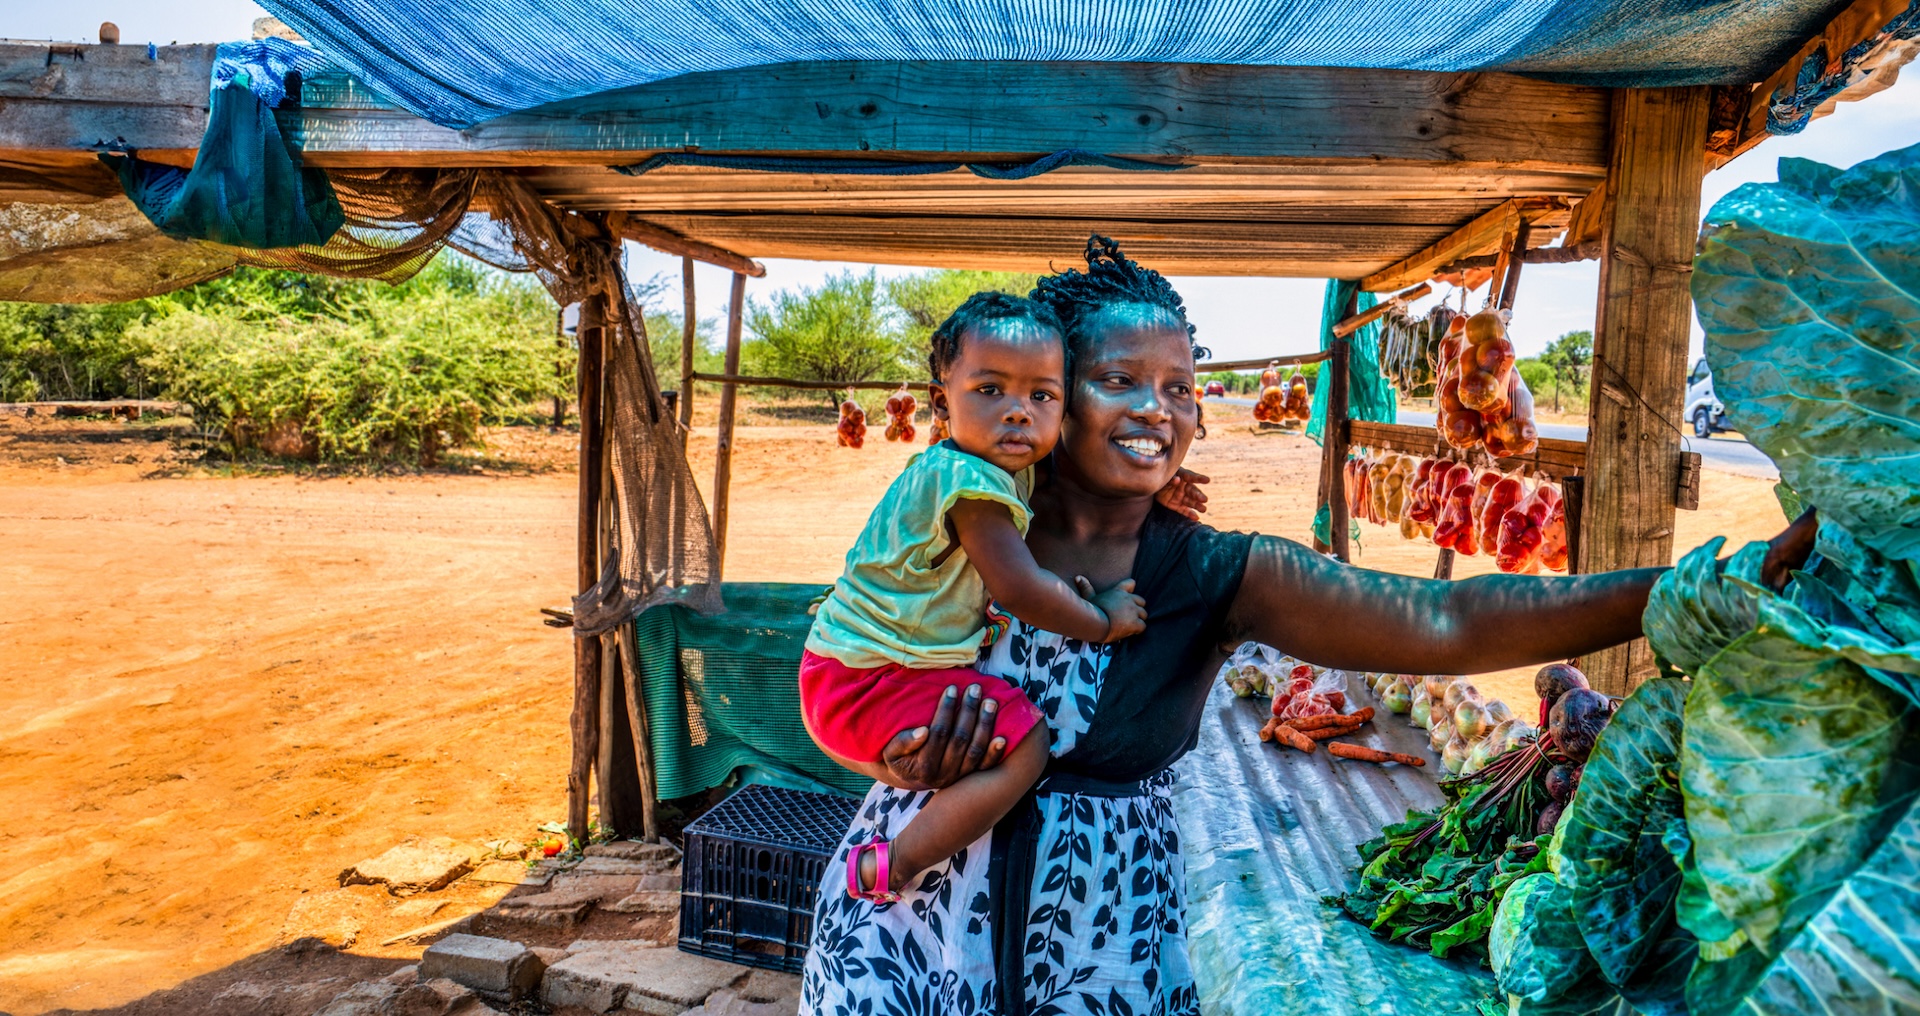
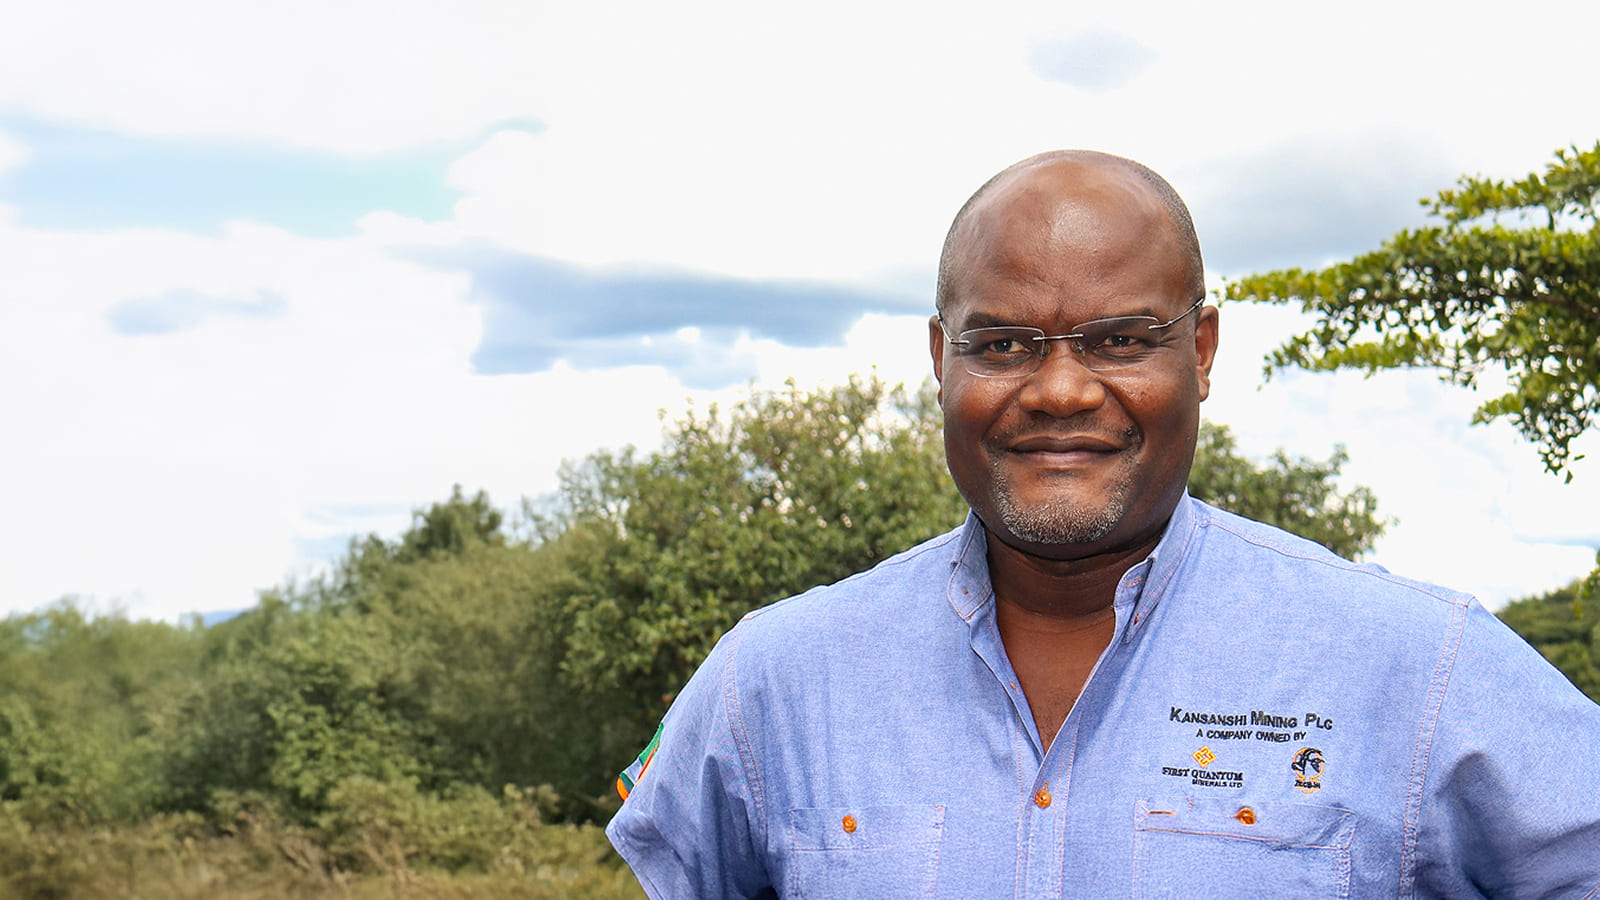
“Kansanshi has been fantastic for our local community, they have contributed to so many developmental projects within the Chiefdom.”
Benson Sendwe,
Village Headman for Mulowa Nyama Village
“I started my career at Kansanshi as a trainee metallurgist. Apart from loving what I do, I’m really grateful for the mentorship and opportunities I have had to grow in my field.”
Wakunoli Munalula Nsofwa,
Superintendent Processing
“First Quantum have been supporting our work in West Lunga for many many years. It’s been a pleasure to work with them to rehabilitate the national park.”
Dorian Tilbury,
Conservation Officer at West Lunga
KANSANSHI S3 INAUGURATION CEREMONY
Traditional leader HRH Chief Kapijimpanga speaks at the Ceremony, 19 August 2025
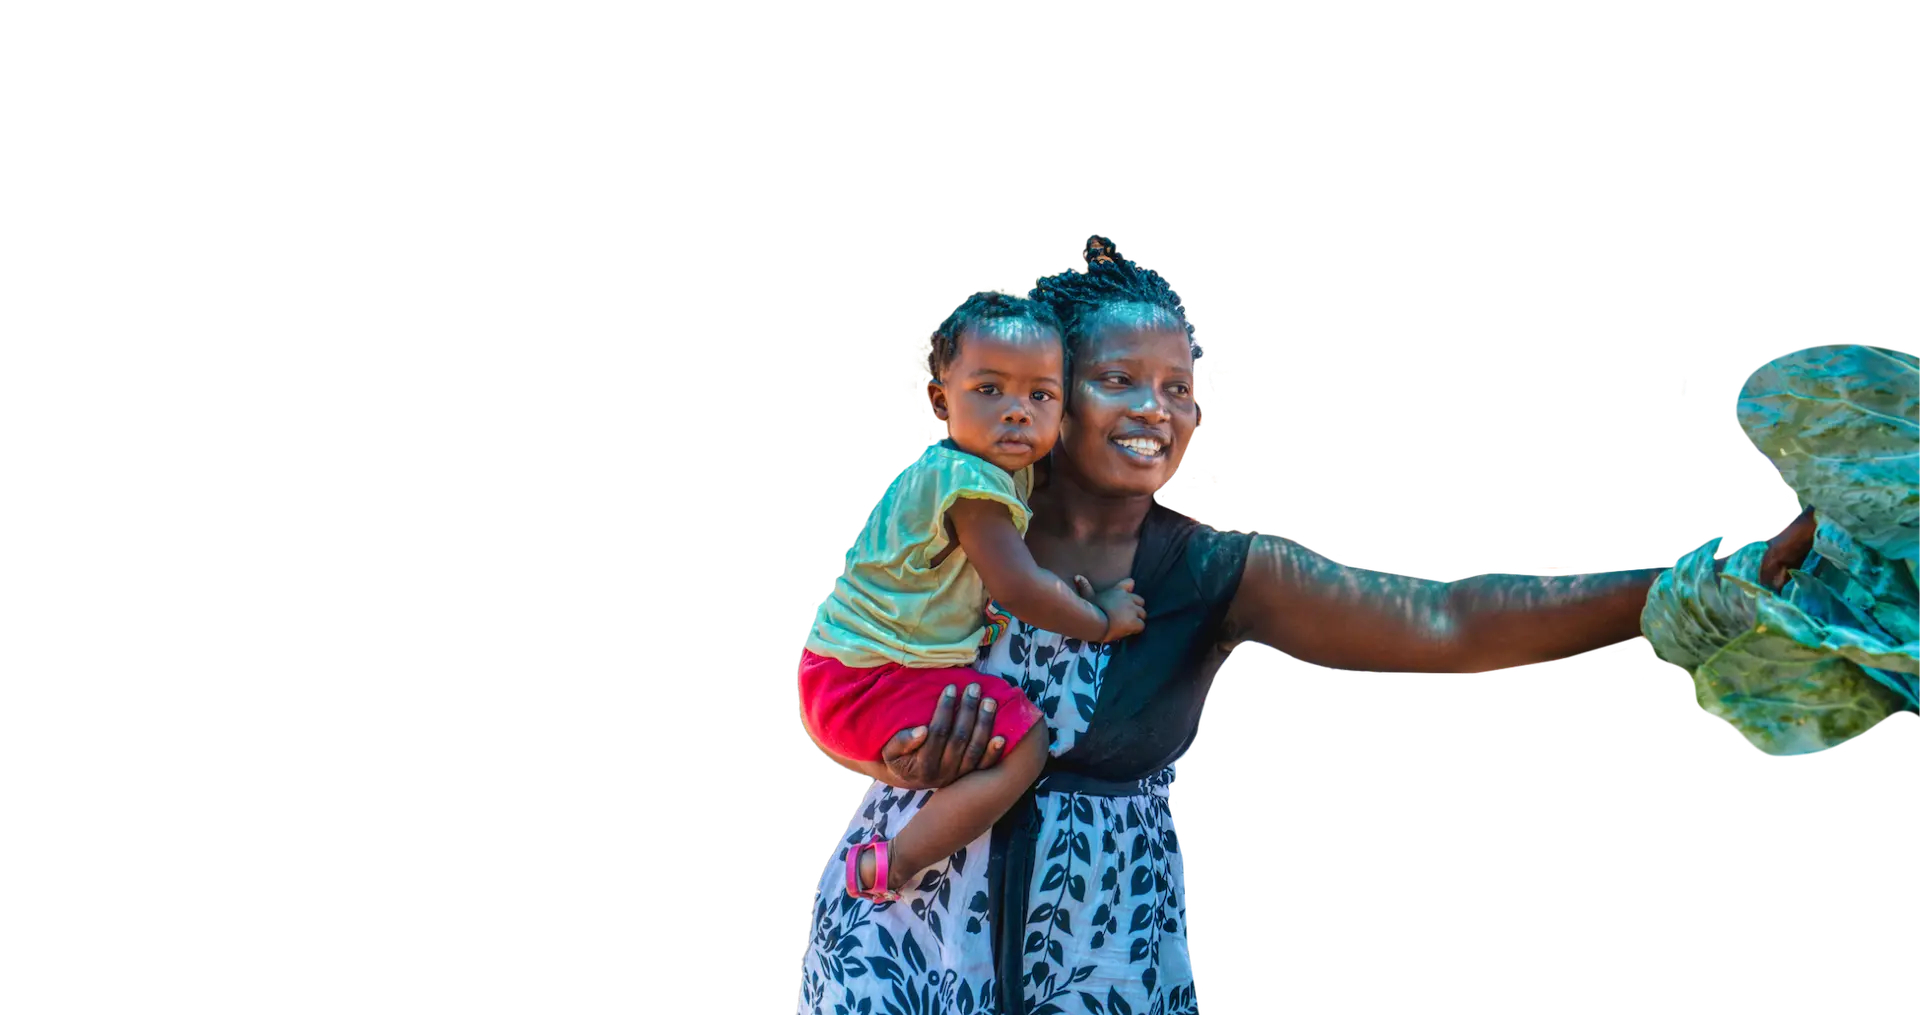
Creating a positive sustainable impact
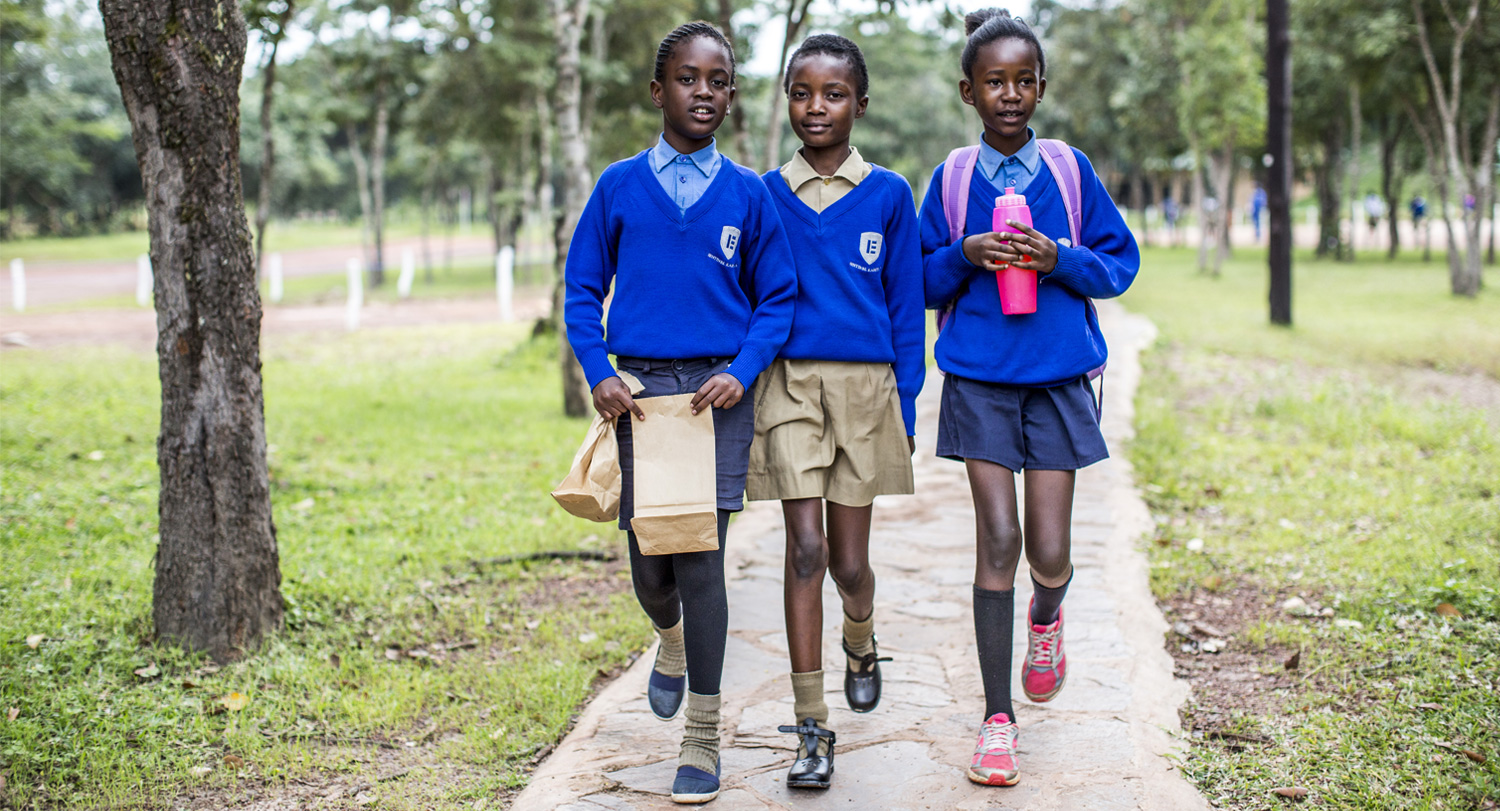
6,000 free lunches
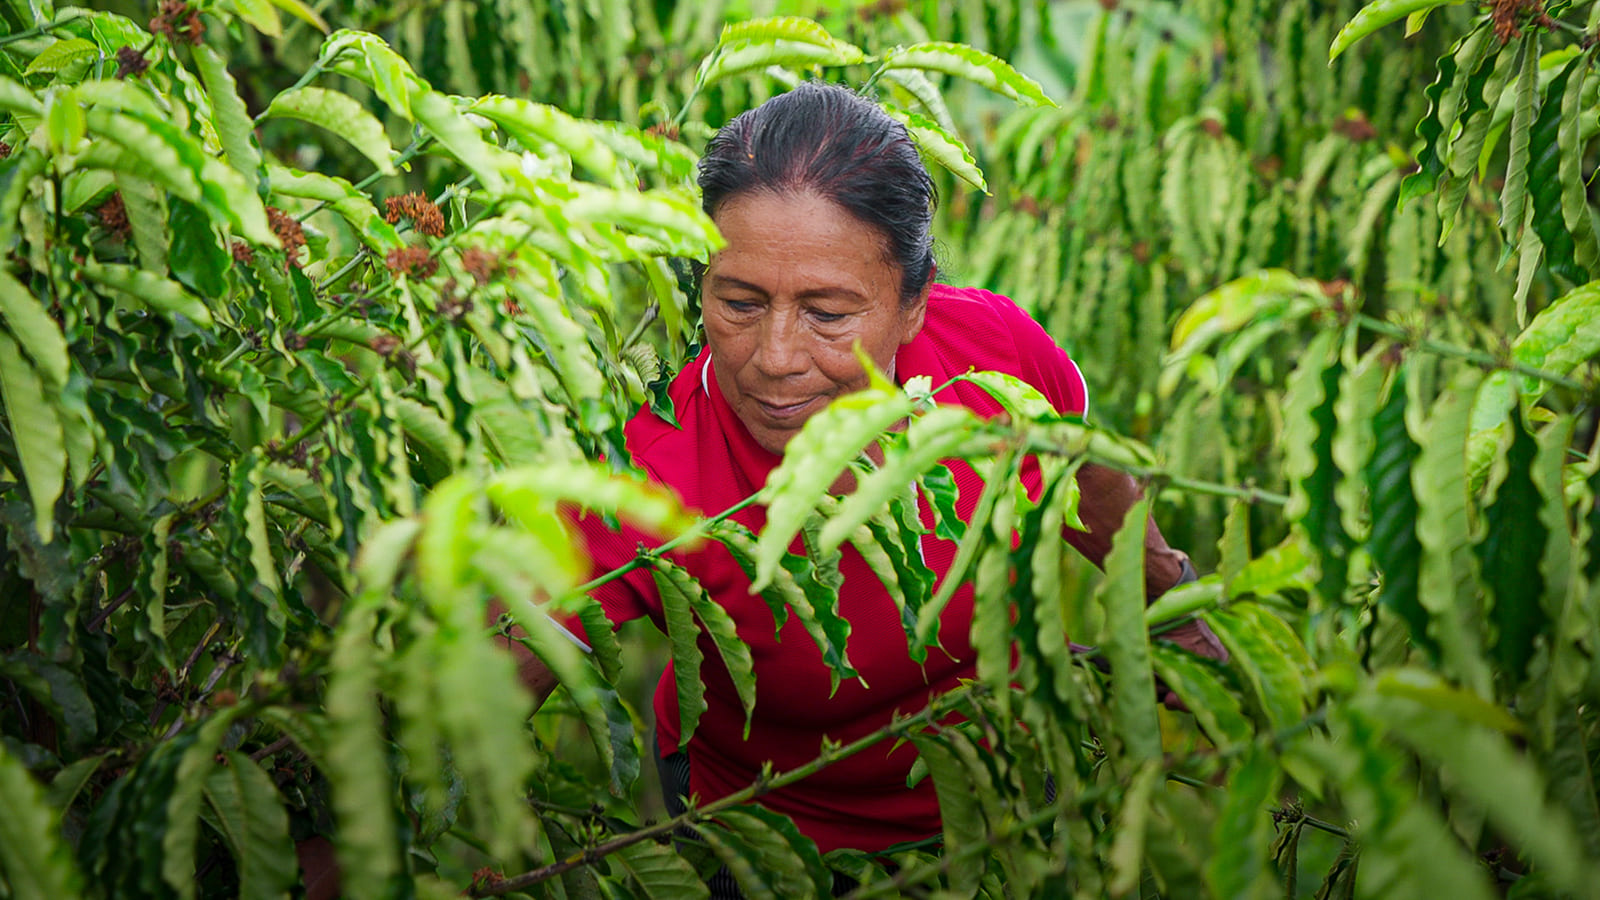
Sustainable farming
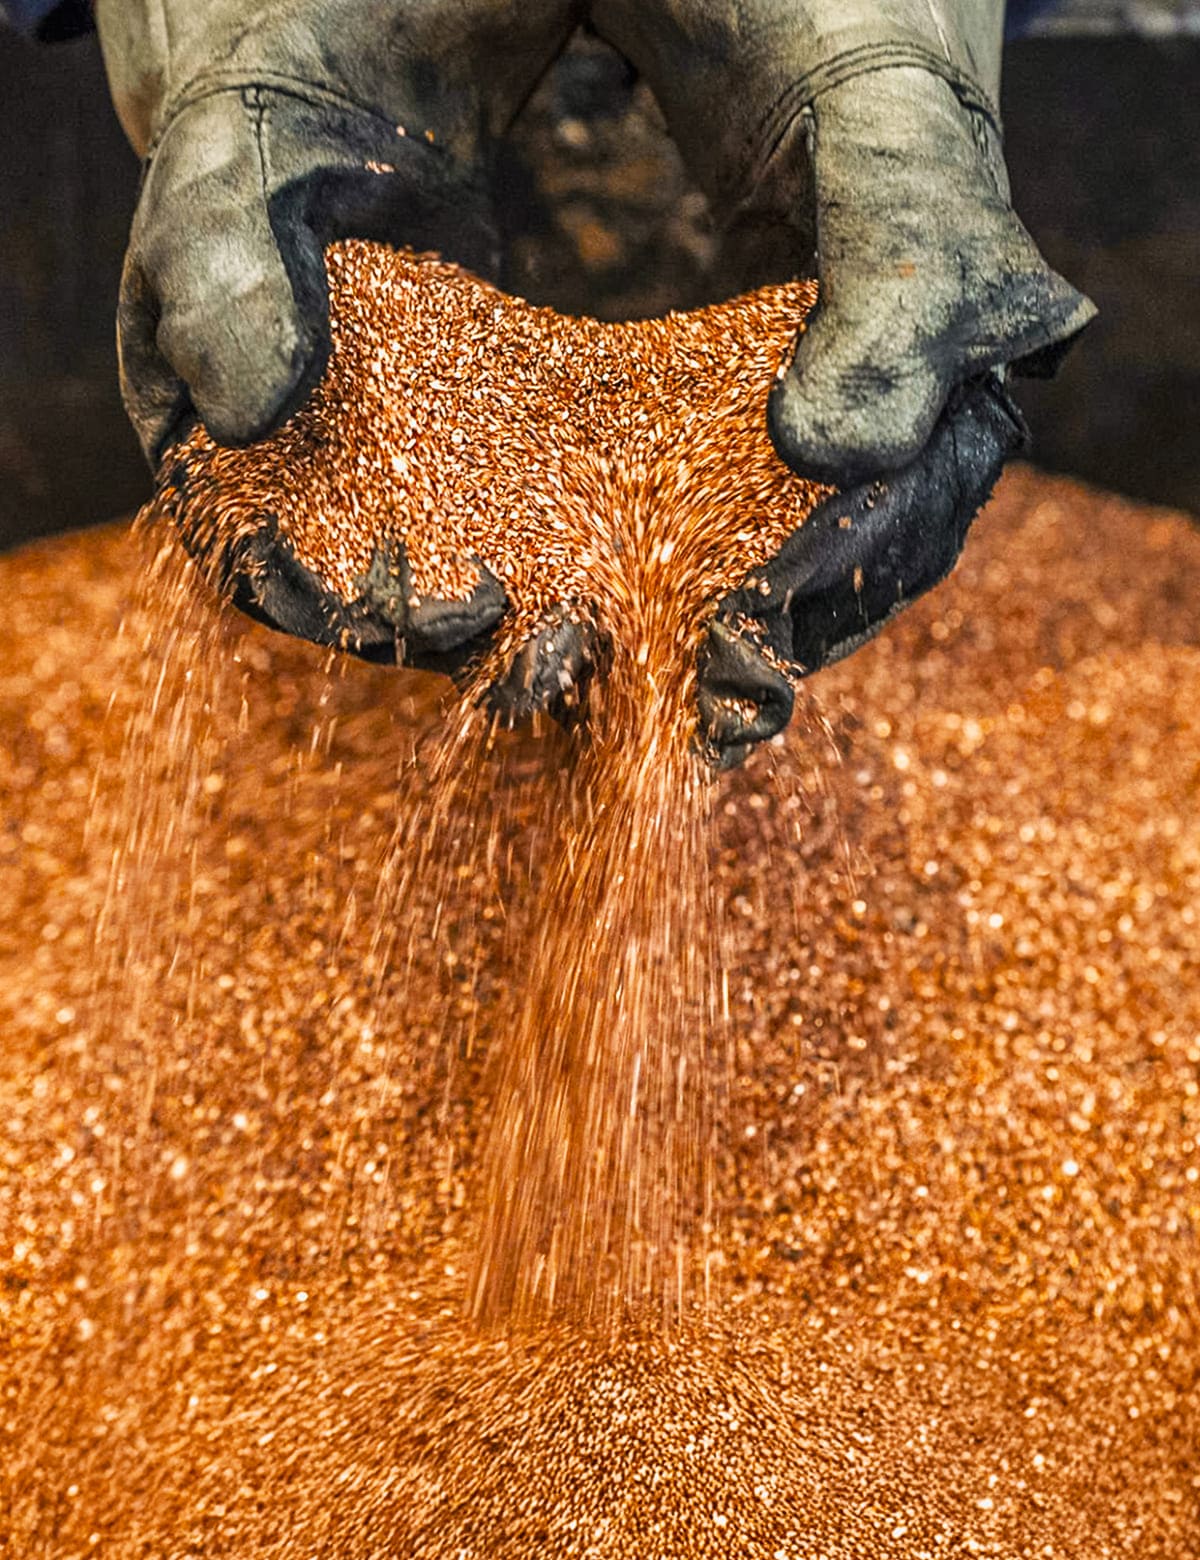
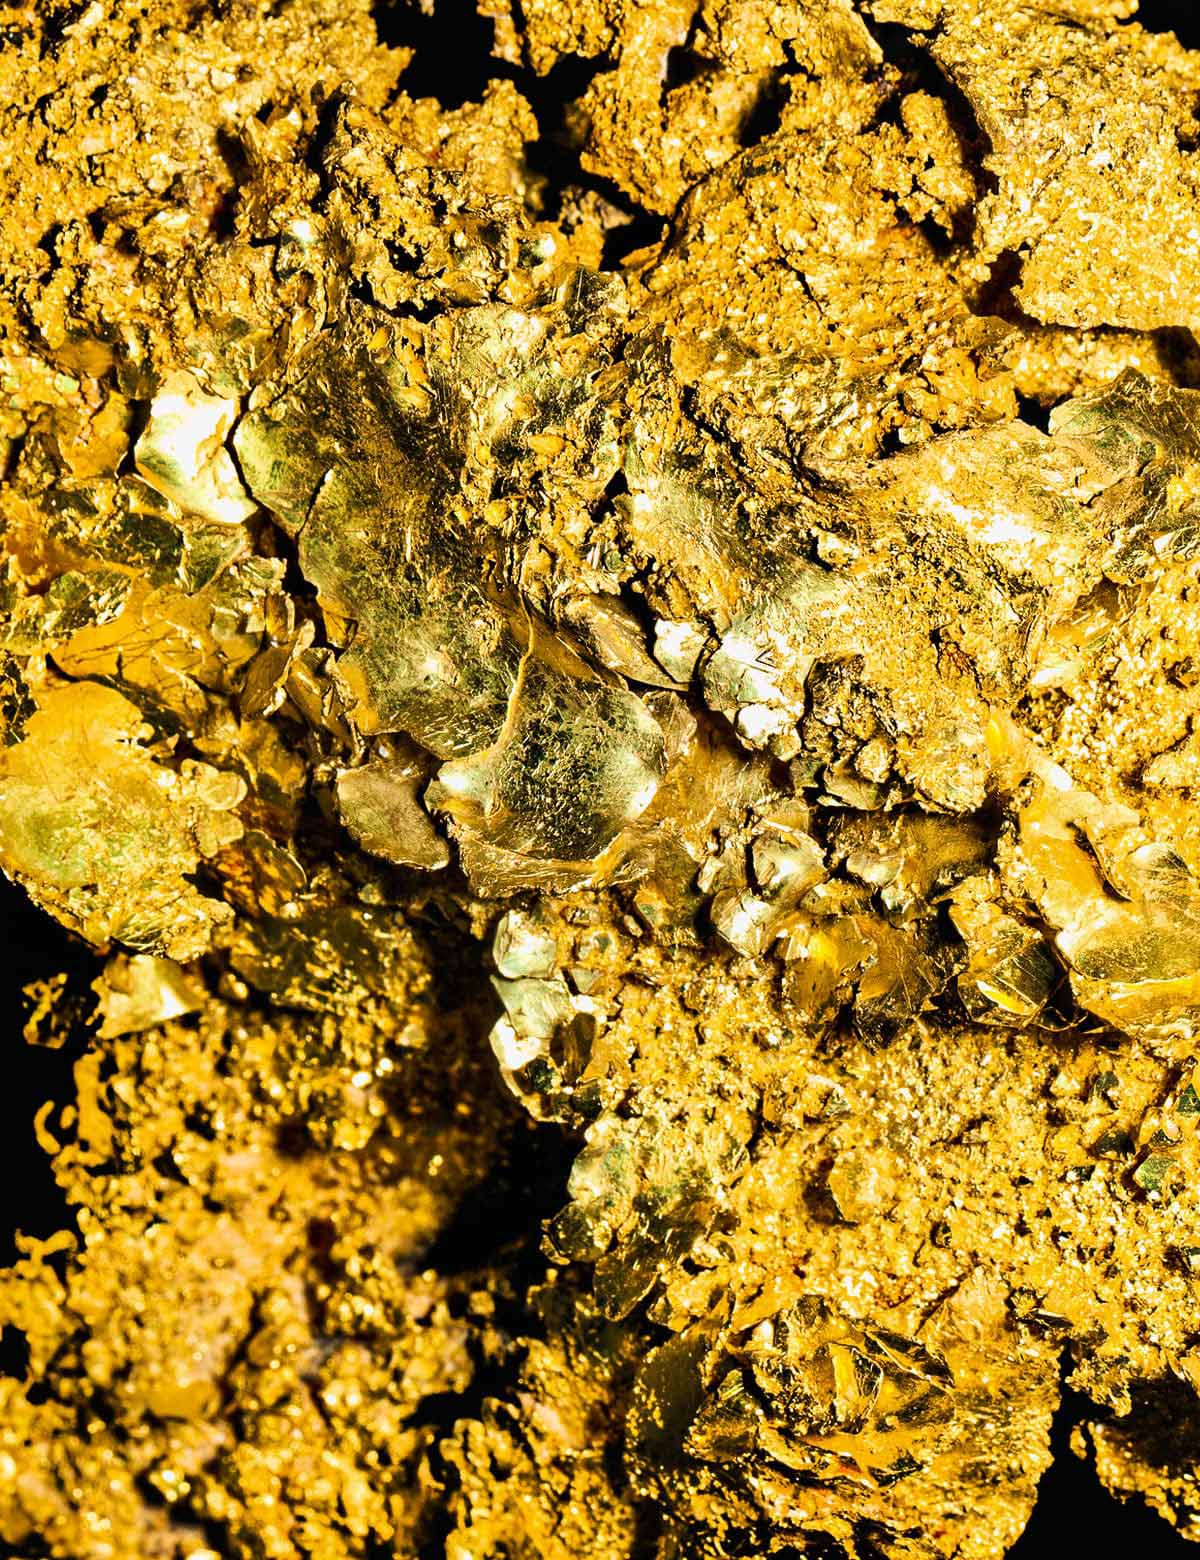
Copper and gold to build tomorrow, today
Our operations are focused on extracting materials that are vital to society, both today and in the future. At Kansanshi, we extract two minerals – copper and gold.
The copper we extract here is used across the world to power homes, build electric vehicles and renewable energy infrastructure and many other things. As one of the largest copper mines in Africa, Kansanshi is incredibly important in helping the world transition to green energy.

Become
a trusted
supplier
Local suppliers
We actively search for and work with local suppliers at each of our operations and projects. We want to hear from experts who share our values and are able to help us achieve our goals. Your journey to become a trusted supplier could start today.

Find a career,
not a job
We hire and train experts, helping every colleague to achieve their full potential. Our lean culture provides the freedom to help us grow and shape our own careers. If you’re looking to start your career, we have fantastic learning opportunities. Careers at First Quantum are as diverse as the locations we work in around the world.
Reserves, resources and production statistics
Find out the most recent Mineral Resource and Reserve estimate. These estimates involve risks and uncertainties, please read our Cautionary Disclosure.
Technical Report
Kansanshi's most recent NI 43-101 Technical Report*
*The company uses qualified persons (as defined by the Canadian Securities Administrators' National Instrument 43-101) to compile this data.
Stay up to date
Sign up to receive updates with insights and stories from around First Quantum, our operations, our projects and our communities.
Sign up